At QuestDB we are all about performance. To showcase querying capabilities of the database we have been running a live demo of historical taxi rides in NYC with 1.6 billion rows 1 and a geospatial dataset that contains the locations of 250k unique ships 2 moving over time. You can analyze this dataset with SQL on our live instance and see how fast each query is processed. Today, we introduce a new dataset on the same demo instance: crypto market data ingested in real-time from the Coinbase Exchange. For ingestion, we use a convenient Python library Cryptofeed, a cryptocurrency exchange feed handler that supports QuestDB. And for visualization, we use Grafana to create interactive live charts, which refresh every 5 seconds.
We ingest the following columns into QuestDB in real-time for each BTC-USD and ETH-USD trades coming through the Coinbase Exchange:
- price
- side (buy/sell)
- amount
- timestamp
To get you started, we added a set of example queries in the live demo of QuestDB web console. These pre-written queries leverage the standard SQL syntax and time-series SQL extensions in QuestDB. When clicking on a query, it's automatically added to the SQL editor. Then, click the Run button or press F9 to execute the query. Despite the large amount of data stored on the demo instance, the queries should come back in milliseconds!
Let's go through these sample queries one by one.
Last prices of BTC and ETH#
To find out the latest prices of BTC and ETH in USD. We use the
LATEST ON syntax, which is
native to QuestDB's SQL Engine:
Below is a real-time chart for Bitcoin and Ethereum prices with a time sample of 10 seconds.
Candle chart sampled by time#
This query returns open, close, minimal and maximal prices as well as cumulated
volumes with 15-minute intervals. We use the
SAMPLE BY syntax, which
aggregates time series data into homogeneous time chunks:
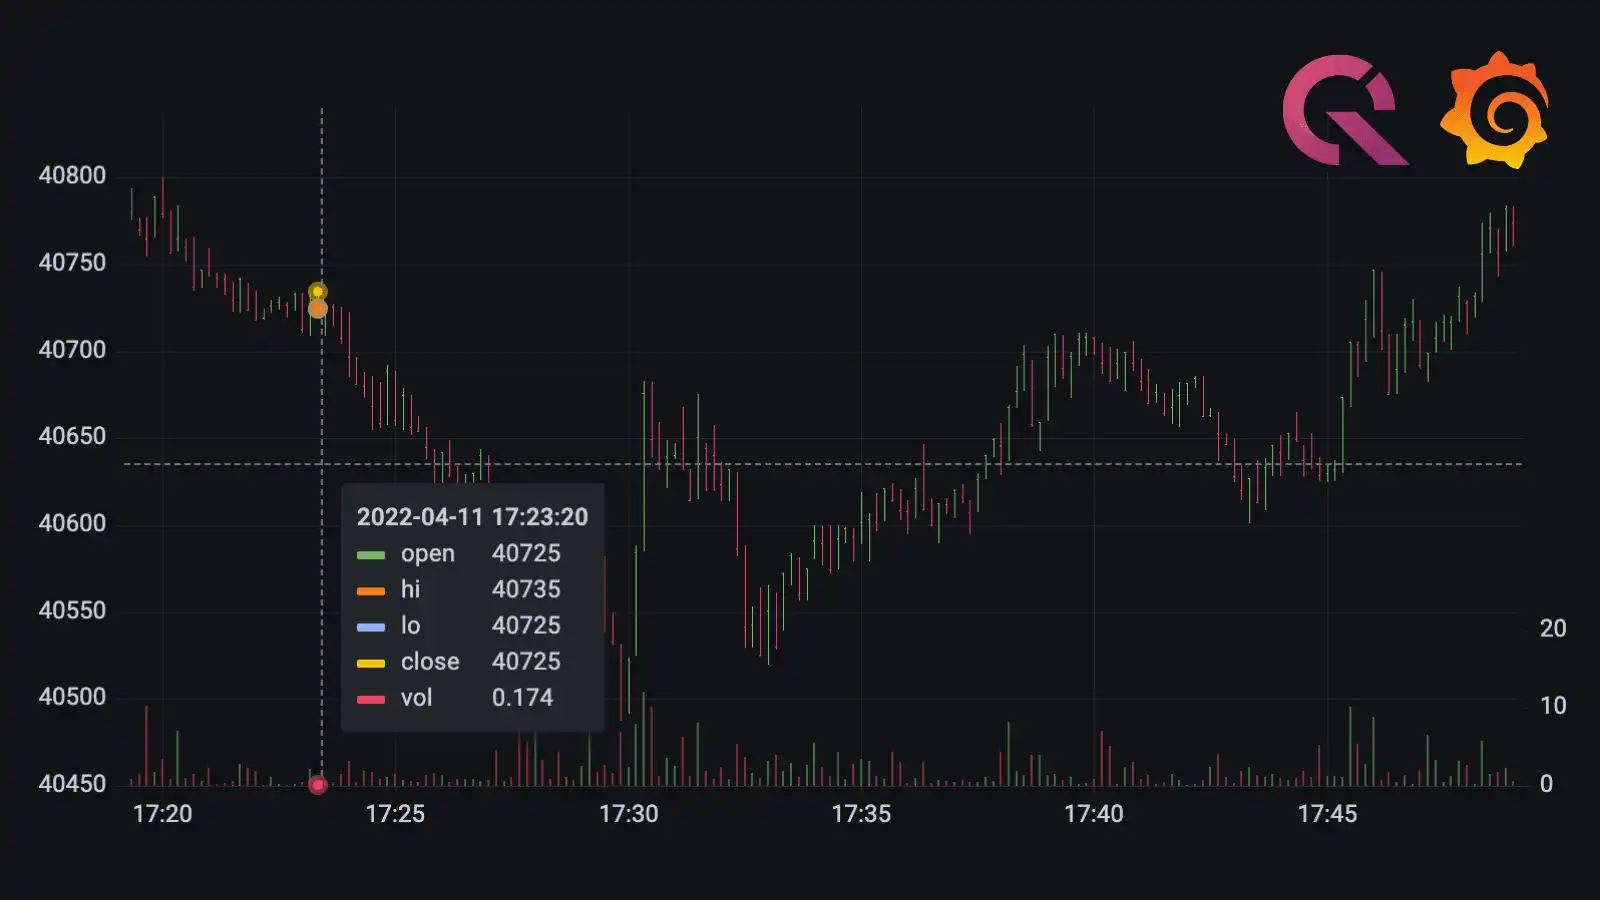
This real-time chart on Grafana plots the candle chart with a time sample of 10 seconds. We also show the volume traded on a secondary axis.
VWAP Bitcoin price sampled by time#
For each 15 minutes interval, we calculate the average price of BTC-USD adjusted
for the volume of trades during that period. This query includes the
WHERE clause that is
accelerated by our new JIT Compiler (see the lightning in the logs). And once
again, we downsample the dataset using SAMPLE BY.
The following real-time chart displays the distribution of trades based on their size and paints a more granular picture of volume traded.
Implied BTC-ETH exchange rate#
The two series of prices for BTC-USD and ETH-USD have different unique
timestamps. In order to join these two series where timestamps do not exactly
match, use the ASOF JOIN syntax and then divide the price of BTC-USD with the
price of ETH-USD to get the implied BTC/ETH rate.
The following real-time chart plots three series: BTC-USD, ETH-USD and the implied BTC-ETH cross price.
Conclusion#
We hope you find these example queries and charts useful to get started. Let us know about other useful queries you build on our demo server! If you're interested in setting up something similar within your organizations or for personal projects, you can get started on GitHub or join our community on Slack.