We've published the latest QuestDB release, and it focuses on community-driven
topics raised with us recently by our users. The features included are
performance improvements, increased parallelization of existing code, and
calendar alignment for SAMPLE BY queries. Also included is the introduction of
a framework for exposing Prometheus metrics by our community member Piotr
Rżysko. Here's the full roundup of changes that have just landed!
QuestDB 6.0.4#
This release fixes issues raised and prioritized by the developer community, and includes stability fixes across several subsystems. The addition of a framework for Prometheus metrics is an exciting feature that we expect will be continuously developed with more types of counters and gauges added as we get feedback on its use. The addition of monitoring using Prometheus will simplify how users gain insights into the performance and activity of deployed instances of QuestDB.
SAMPLE BY with calendar alignment#
It's now possible to perform SAMPLE BY queries where the sampled groups align
strictly to calendar dates with optional time zones and offsets. The default
behavior for sampling is unchanged from previous releases, and calendar
alignment is possible through the use of the following optional keywords:
For more information on using calendar alignment with sampled groups, see the SAMPLE BY documentation.
SQL performance improvements#
We gathered user feedback on the most critical query types that require faster
execution speed, and we have improved LATEST BY handling internally. These
enhancements are possible by massively parallelizing how these operations are
executed and optimizing aggregate calculations within sampled groups. Users will
see these improvements with the following two query types:
Prometheus metrics#
The new implementation for Prometheus monitoring
allows for adding basic counters and will be improved in upcoming releases. To
activate Prometheus metrics, set the metrics.enabled key to true in
QuestDB's server.conf configuration file:
Create a Prometheus configuration file that points to QuestDB's metrics endpoint
on 9003:
Start Prometheus, passing the configuration file with the QuestDB settings:
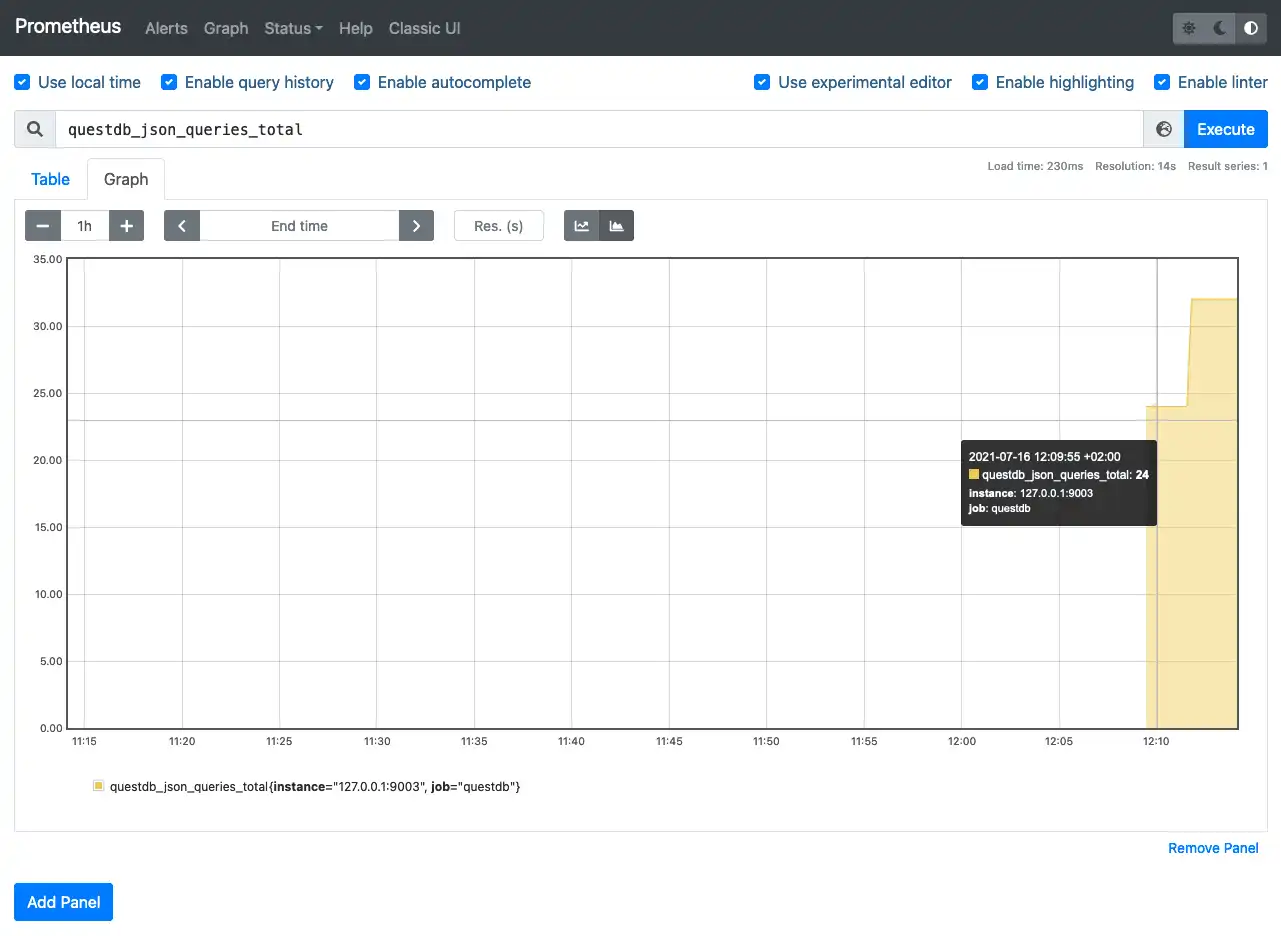
The initial implementation adds a basic counter for the number of executed SQL queries which can be charted, or alerts may be configured for this metric. If you have some suggestions for the types of counters and gauges we should include, let us know on GitHub.
Breaking changes#
The addition of special handling for null in
#1179 introduces changes that
enforce timestamps having only positive values. This means that timestamps
cannot predate epoch 0 in UTC, disallowing pre-1970 values.
How to run QuestDB 6.0.4#
The release notes including a changelog is available on GitHub and this version has been published to Docker Hub:
To start up QuestDB, use docker run:
Next up#
We are now trying out GitHub discussions as a way to get the conversation about QuestDB started! We have some great topics already so far since we activated this feature, and we expect this to be a fun and easy way to get involved on GitHub with open-ended discussions.
We're eagerly awaiting feedback on this release, so feel free to reach out and tell us how this version is running. Let us know how we're doing or just come by and say hello in our Slack Community or browse the repository on GitHub.